t Distribution & Small
Samples
Lots of Worked-Out,
Easy-To-Understand, Graduate-Level Problems --->
( Scroll Down and Take a Look ! )
The t Distribution is often applied to small samples (n<30)
to estimate a Confidence Interval of the mean for a much
larger population. It is also used to perform a Hypothesis test
called a t-test which determines whether the means of two
groups are statistically different from each other.

Basic Description of the t
Distribution
t Distribution Probability Density Function
Degrees of Freedom
One Very
Important Caution About Using the t Distribution
The Normal Distribution
and Large Samples
Estimating
Confidence Intervals with the t Distribution
Levels of Confidence and
Significance
Population Mean vs. Sample Mean
Standard Deviation vs.
Standard Error
Region of Certainty
vs., Region of Uncertainty
t Value
Formula for
Calculating Confidence Interval Boundaries
What Is the t Test?
How To Use the t Test in Excel To Find Out If Your New Marketing Is Working
Normality Tests - When the
Marketer Should Use Them
Using the Excel t Test To Find Out What Your Best Sales Days Are
When Should the Marketer Use Nonparametric Tests
A Quick, Easy Normality Test For Excel
Nonparametric Tests - Completed Examples in Excel
The 7 Most Common Correctable Causes of Sample Data Appearing Non-Normal
A Quick Normality Test Easily Done in Excel
Using the Excel t Test To Find Out What Your Best Sales Days Are
Nonparametric Tests - Completed Examples in Excel
Nonparametric Tests - When the Marketer Should Use Them
The Chi-Square Goodness-of-Fit Test - Excel's Easiest Normality Test
The Mann-Whitney U Test Done in Excel
The Kruskal-Wallis
Test Done in Excel
The Spearman Correlation Coefficient Test Done in Excel
The Sign Test (Nonparametric) Done in Excel
The Wilcoxon Rank Sum Test Done in Excel
The Wilcoxon Signed-Rank Test for Small Samples Done in Excel
The Wilcoxon Signed-Rank Test for Large Samples Done in Excel
Problem 1 - Calculate a Confidence Interval Based on Small Sample Data Using
the t Distribution
t Test and Hypothesis Testing

The t Distribution curve looks very much like the bell-shaped
Normal Distribution curve, except it is lower, flatter, and wider.
In the real world, data often has heavier tails than the Normal
Distribution describes. This is often caused by outliers. If it
difficult to remove or downweigh the outliers, then the
t Distribution is often used to replace the Normal Distribution.
The t Distribution is also called the Student's t Distribution. The t
Distribution was first published by William Sealy Gosset in 1908. At that
time W. S. Gosset was employed by the Guinness Brewery in Dublin. Due to
proprietary issues, Gossett published his work under the pseudonym of
"Student." Later R. A. Fisher published the t-test and referred to Gosset's
distribution the "t Distribution." Since then, the distribution has been
known as the Student's t distribution, or t distribution for short.
The Probability Density Function for the t Distribution
at point t requires only 1 parameter, ѵ, the number of
Degrees of Freedom. The Degrees of Freedom,
ѵ, is equal
the Sample Size Minus 1 ---->
ѵ =
n - 1
The t Distribution depends only on
ѵ, the number of
Degrees of Freedom. It does not depend on the mean,
µ, or the standard
deviation, σ, as does the Normal Distribution. This lack
of dependence on the mean or standard deviation makes
the t Distribution important in practice.
t-Distribution Basic
Definition
Probability Density Function for
the t Distribution = f(t,ѵ)
f(t,ѵ) = c ( 1 + t2/ѵ)-((ѵ+1)/2)
c = [ Γ( (ѵ+1)/2 ) ] / [ SQRT( ѵ * π) * Γ(ѵ/2) ]
c = [ Γ( (ѵ+1)/2 ) ] / [ SQRT( ѵ * 3.14159265) * Γ(ѵ/2)
]
Γ(x) is the Gamma Distribution.
The above formula is difficult to work with. It is
definitely better to use t Value charts to obtain the
value of f(t,ѵ). The
use of t Value charts is discussed below.

The Degrees of Freedom equals the number of values of a statistic that are
free to vary. In general, this is equal the number of independent sample
scores that must be taken (Sample Size = n) minus the number of parameters
that must be estimated during the calculation of the statistic.
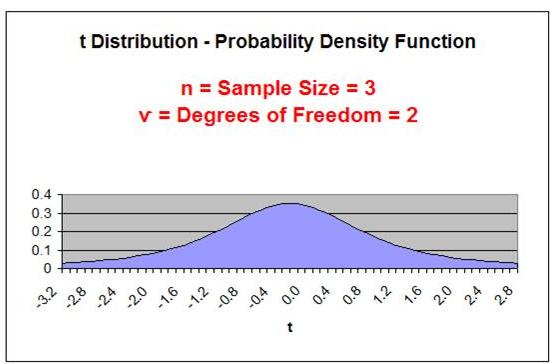
The shape of a t Distribution depends upon sample size,
n.
An important parameter related to sample size is the Degrees
of Freedom, or ѵ ("nu") ---> (also sometimes written as df )
Degrees of Freedom =
ѵ = n - 1
Sample Size = n
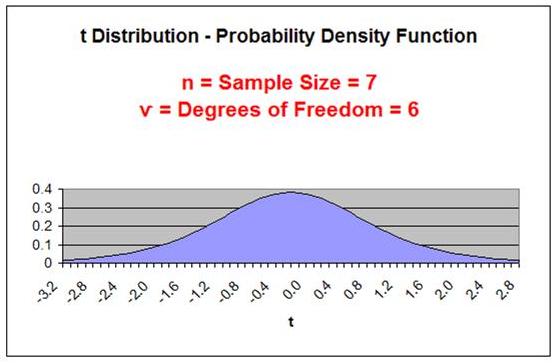
The smaller the Degrees of Freedom, the lower and flatter
is the t Distribution curve. The lowest, flattest t Distribution
occurs at ѵ = 1 (sample size,
n, equals 2). As the Degrees
of Freedom increase, the t Distribution becomes higher and
more peaked to approach the shape of the Normal
Distribution curve. At approximately n = 30, the t
Distribution begins to very closely resemble the Normal
Distribution.
Degrees of Freedom
ѵ = Degrees of
Freedom = n - 1
n = Sample Size
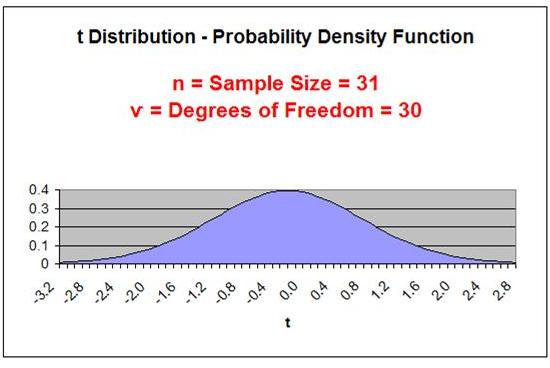
The number of Degrees of Freedom is the main parameter
of the t Distribution.
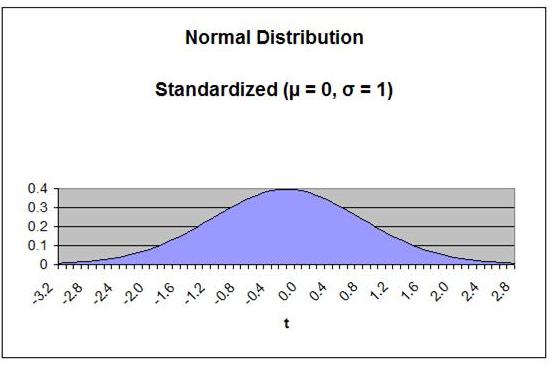
As the Degrees
of Freedom increase, the tails get thinner and the peak
of the curve gets higher. After the Degrees of Freedom
exceed 30, the t Distribution closely resembles the
Normal curve, as is shown below:

Applying the t Distribution to small samples should only be
done if it can be proven that the underlying population
is Normally distributed. This is not usually the case.
The derivation of the t Distribution is based upon the
sample being drawn from a Normally distributed population.
If the t Distribution is applied to small sample data
to estimate the Confidence Interval of the mean of an
underlying population that is not Normally distributed,
the result can be totally wrong.
Tests of normality include the Chi-Square Goodness
of Fit Test. A link to this test in Excel is shown
in the table of contents above.
The Normal distribution can be applied to large sample
data to estimate the Confidence Interval of the mean
for any population regardless of the population's
distribution. Statistics' most basic rule, the Central
Limit Theorem, provides the basis for this. This is
explained in more detail in the course module entitled
"Confidence Intervals."
If a population's underlying distribution is unknown, it is
highly advisable that sample size be large (n > 30).
This course module will provide a basic explanation
of the calculations of a population's Confidence Interval of
the mean from small sample data using the t Distribution. A
more detailed explanation of estimating a Confidence Interval
can be found in the course module entitled "Confidence
Intervals."
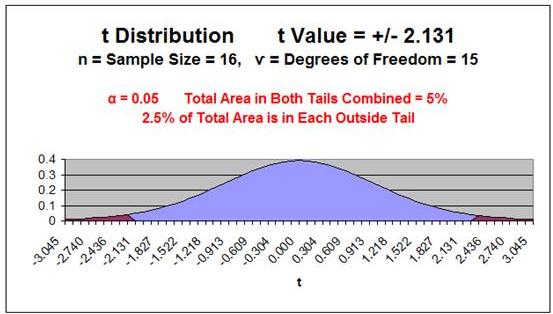
Level of Significance,
α ("alpha"), equals the maximum allowed percent of
error. If the maximum allowed error is 5%, then α = 0.05.
Level of Confidence is selected by the user. A 95% Confidence
Level is the most common. A 95% Confidence Level would correspond to
a 95% Confidence Interval of the Mean. This would state that the actual
population mean has a 95% probability of lying within the calculated interval.
A 95% Confidence Level corresponds to a 5 Level of Significance, or
α = 0.05.
The Confidence Level therefore equals 1 - α.
Population Mean =
µ ("mu") (This is what we are trying to estimate)
Sample Mean = xavg
Standard Deviation is a measure of statistical dispersion. It's formula is
the following: SQRT ( [ SUM
(x - xavg)2
] / N ).
Standard Deviation equals the square root of the Variance.
Population Standard Deviation =
σ ("sigma")
Sample Standard Deviation =
s
Standard Error is an estimate of population Standard Deviation from data
taken from a sample. If the population Standard Deviation,
σ, is known, then
the Sample Standard Error, sxavg, can be calculated. If only the Sample
Standard Deviation, s, is known, then Sample Standard Error,
sxavg, can be
estimated by substituting Sample Standard Deviation,
s, for Population
Standard Deviation, σ, as follows:
Sample Standard Error = sxavg =
σ / SQRT(n) ≈
s / SQRT(n)
σ = Population standard deviation
s = Sample standard deviation
n = sample size
Region of Certainty is the area under the Normal curve that corresponds
to the required Level of Confidence. If a 95% percent Level of Confidence is
required, then the Region of Certainty will contain 95% of the area under
the Normal curve. The outer boundaries of the Region of Certainty
will be the outer boundaries of the Confidence Interval.
The Region of Certainty, and therefore the Confidence Interval, will be
centered about the mean. Half of the Confidence Interval is on one side
of the mean and half on the other side.
Region of Uncertainty is the area under the Normal curve that is
outside of the Region of Certainty. Half of the Region of Uncertainty will
exist in the right outer tail of the Normal curve and the other half in the
left outer tail. This is similar to the concept of the "two-tailed test" that
used in Hypothesis testing in further sections of this course. The
concepts of one and two-tailed testing are not used when calculating
Confidence Intervals. Just remember that the Region of Certainty, and
therefore the Confidence Interval, are always centered about the mean
on the Normal curve.
The Region of Uncertainty corresponds to α ("alpha").
If α = 0.05, then that Region of Uncertainty contains 5% of the area under the
Normal curve. Half of that are (2.5%) is in each outer tail. The 95% area
centered about the mean will be the Region of Certainty. The outer
boundaries of this Region of Certainty will be the outer boundaries of
the 95% Confidence Interval. The Level of Confidence is 95% and the
Level of Significance, or maximum error allowed, is 5%.
t Value is the number of Standard Errors from the mean to outer right boundary
of the Region of Certainty (and therefore to the outer right boundary of the
Confidence Interval). Standard Errors are used and not Standard Deviations
because sample data is being used to calculate the Confidence Interval.
The outer right boundary of the 95% Confidence Interval, and the Region of
Certainty, is 2.57 Standard Errors from the mean. The left boundary
is the same distance from the mean because the Confidence
Interval is centered about the mean.

Confidence Interval Boundaries = Sample mean +/- t Value(α, ѵ) * Sample Standard
Error
Confidence Interval Boundaries =
xavg
+/- t Value(α, ѵ) *
sxavg
Problem: Given the following set of 16 random test scores taken
from a much larger population THAT IS NORMALLY DISTRIBUTED,
calculate with 95% certainty an interval in which the population
mean test score must fall. In other words, calculate the 95%
Confidence Interval for the population test score mean using
the t Distribution.
16 Random Test Score Samples from a Much Larger
Population
| 220 |
370 |
| 370 |
220 |
| 500 |
640 |
| 640 |
500 |
| 220 |
370 |
| 370 |
220 |
| 500 |
640 |
| 640 |
500 |
Level of
Confidence = 95% = 1 - α
Level of Significance
= α = 0.05
Sample Size =
n = 16
Degrees of Freedom
= ѵ
=
n - 1 =
16 - 1 = 15
Sample Mean =
xavg
= 432.5
Sample Standard Deviation
= SQRT ( [ SUM
(x
-
xavg)2
] / n ) = 160.6
Sample Standard Error
= sxavg
= / SQRT(n) ≈
s / SQRT(n)
Sample Standard Error
= sxavg
≈ s
/ SQRT(n) = 160.6 / SQRT(16) = 40.2
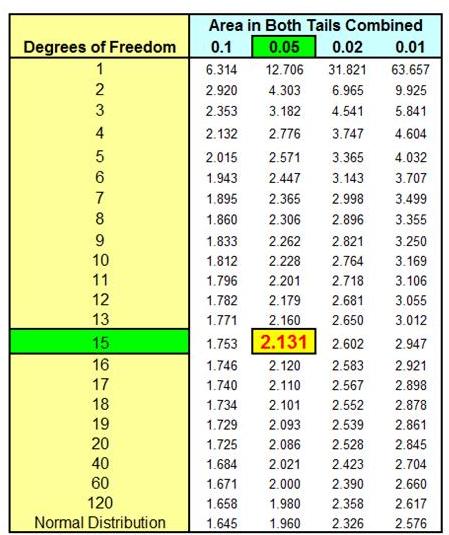
t Value(α=0.05,
ѵ = 15) = 2.131
Width of Half the Confidence Interval
= t Value(α, ѵ) *
Sxavg
Width of Half the Confidence Interval
= 2.1314 * 40.2 = 85.7
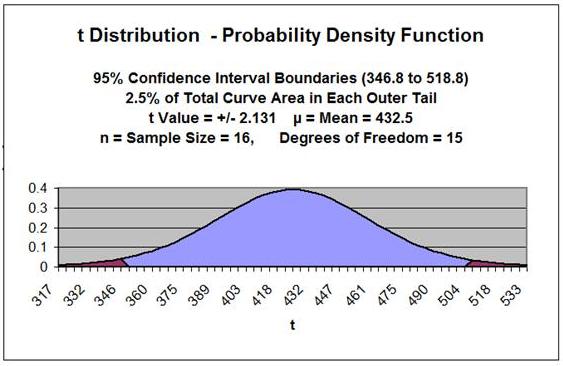
Confidence Interval Boundaries
= xavg
+/- t Value(α, ѵ) *
Sxavg
Confidence Interval Boundaries
= 432.5 +/- (2.1314)*(40.2) = 432.5 +/- 85.7
Confidence Interval Boundaries
= 346.8 to 518.8
This same problem is solved in the Excel Statistical Master with only 3 Excel formulas (and not having to look up anything on a T Chart). The Excel Statistical Master teaches you everything in step-by-step frameworks. You'll never have to memorize any complicated statisical theory.
The t Test is a Hypothesis test that is used to test whether the means of two
groups are statistically different from each other.
Quite often the t Test is applied to small sample data. As with
other applications of the t Distribution to small sample data,
the underlying population must be Normally distributed. This
is often not the case.
The t Test will not be covered in this module because the
two modules that cover Hypothesis testing provide
significant detail about the topic.
The module of this course entitled "Excel Hypothesis
Tools" provides examples of three different t Tests
that are Data Analysis Tools of Excel. These are:
• t-Test: Paired Two Sample from Means
• t-Test: Two Sample Assuming Equal Variances (This is not a common situation)
• t-Test: Two Sample Assuming Unequal Variances
•
Statistical Mistakes You Don't Want To Make
•
A Quick Normality Test Easily Done in Excel
•
How To Use the t Test in Excel To Find Out If Your New Marketing Is Working
• The 7 Most Common Correctable Causes of Sample Data Appearing Non-Normal
• Using the Excel t Test To Find Out What Your Best Sales Days Are
• Nonparametric Tests - Completed Examples in Excel
• Nonparametric Tests - How To Do the 4 Most Important in Excel
• Nonparametric Tests - When the Marketer Should Use Them
Non-parametric tests can be used as alternatives to the
t Test if large samples cannot be obtained and Normality
of the underlying population cannot be proven. Some
examples of applicable non-parametric tests would
be the Mann-Whitney U test and the Wilcoxon test.
Copyright 2013