Wouldn’t it be great if there was a more accurate way to predict whether your prospect will buy rather than just taking an educated guess? Well, there is…if you have enough data on your previous prospects. The tool that makes this possible is called Logistic Regression and can be easily implemented in Excel.
Marketers use Logistic Regression to rank their prospects with a quality score which indicates that prospect’s likelihood to buy. The more data you’ve collected from previous prospects, the more accurately you’ll be able to use Logistic Regression in Excel to calculate your new prospect’s probability of purchasing.
On the following page is a video which will show you how to perform Logistic Regression in Excel and why it works. The example that will be presented in the video will also be covered below in the article:
(Is Your Sound and Internet Connection Turned On?)
Amazon Kindle Users Click here to View Video
Logistic Regression calculates the probability of the event occurring, such as the purchase of a product. In general, the thing being predicted in a Regression equation is represented by the dependent variable or output variable and is usually labeled as the Y variable in the Regression equation. In the case of Logistic Regression, this “Y” is binary. In other words, the output or dependent variable can only take the values of 1 or 0. The predicted event either occurs or it doesn’t occur – your prospect either will buy or won’t buy. Occasionally this type of output variable also referred to as a Dummy Dependent Variable.
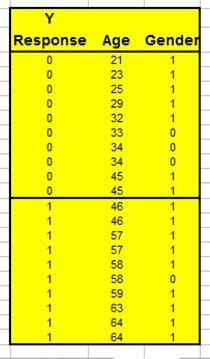
Here is a marketing example showing how Logistic Regression works. The embedded video walks through this example in Excel as well: Suppose that you have collected three pieces of data on each of your previous prospects. The data you have collected on each prospect was:
1) The prospect’s age
2) The prospect’s gender (1 = Male and 0 = Female)
3) Whether the prospect purchased or not (Did purchase Y = 1, Did not purchase, Y = 0).
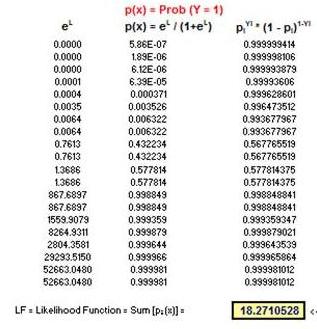
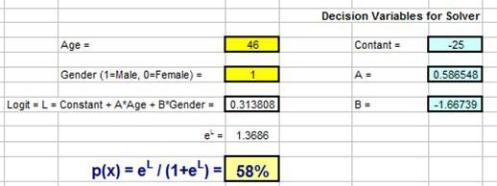
With the above data, you could create a predictive equation that would calculate a new prospect’s probability of purchasing by inputting this new prospect’s age and gender. This predictive equation will be in the form of: P(X) = eL/ (1+eL)
P(X) represents the possibility of event X occurring.
Event X is a purchase. In other words, P(X) is the probability that Y = 1.
P(X) has only one variable. That is L, which is called the Logit.
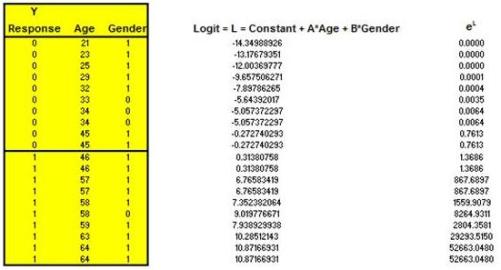
The Logit, L = Constant + A * Age + B * Gender
L, the Logit, has 3 variables: Constant, A, and B. They must be known before P(X) can be calculated. Those 3 variables can be found in Excel by using the Excel Solver. The Excel Solver will find the optimal combination of those 3 variables that causes the resulting P(X) to most accurately predict whether Y = 1 or 0 for all previous prospects.
Everything To the Right of the Above Is Continued Below:
Here’s how the most optimal set of Logit variables (Constant, A, and B) are found in Excel:
Using Excel, each recorded prospect has the following calculation performed:
P(X)Y * [ 1 - P(X) ] (1-Y)
The Y refers to Y = 1 if the prospect bought and Y = 0 if the prospect didn’t buy.
The P(X) is the probability of purchase that will be calculated using the equation listed above. In Excel, the P(X) calculation is initially performed by the Excel Solver using Logit variables (Constant, A, and B) which are not optimal. The Excel Solver will then continuously try new combinations of these variables until the optimal P(X) is found.
Here’s how the Excel Solver knows when it has found the correct combinations of these 3 variables so that the resulting P(X) equation most accurately predicts whether Y = 1 or 0:
The equation P(X)Y * [ 1 - P(X) ] (1-Y) is maximized when P(X) is most accurate. It approaches it highest value (1) when Y = 1 and P(X) approaches 1. It also approaches its highest value (1) when Y = 0 and P(X) approaches 0.
When Y = 1 and P(X) = 1, that is a 100% correct prediction by P(X) that Y = 1.
When Y = 0 and P(X) = 0, that is a 100% correct prediction by P(X) that Y = 0.
Each prospect has a separate P(X)Y * [ 1 - P(X) ] (1-Y) value calculated for him or her.
The sum of each P(X)Y * [ 1 - P(X) ] (1-Y) calculation for all prospects is taken.
The only variables that exist when calculating P(X)Y * [ 1 - P(X) ] (1-Y)are Y and the variables of P(X), which are Constant, A, and B. Use the Excel Solver, these variable are adjusted until their values maximize the sum of all P(X)Y * [ 1 - P(X) ] (1-Y)
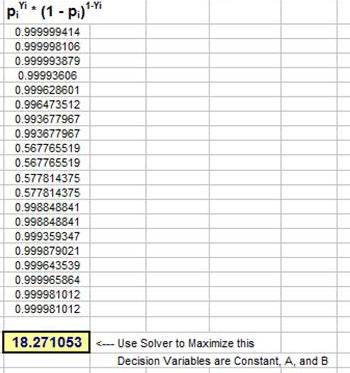
When the sum of P(X)Y * [ 1 - P(X) ] (1-Y) is maximized, then the final resulting P(X) equation is as accurate as possible at predicting whether Y will be 1 or 0.
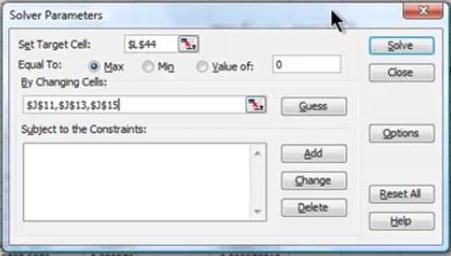
The Excel Solver Dialogue Box
Stated another way, we now have a predictive equation P(X ) which uses the optimal combination of Constant, A, and B which most accurately calculates the probability that Y = 1 given a prospect’s age and gender.
The embedded video provides a clear picture of all of this in action in Excel.
The use of the Excel Solver does require some hand-tweeking to ensure that the most accurate answer is obtained. The video shows an example of this.
Ultimately what the Solver is doing is adjusting variables Constant, A, and B to maximize the sum of the column of P(X)Y * [ 1 - P(X) ] (1-Y) equations. The answer obtained by the Solver should maximize that sum and provide realistic answers for the probabilities of each prospect, including the new one.
You’ll probably find that you have to experiment by applying constraints to the variables that Solver is adjusting in order to maximize the target sum. The variables that Solver adjusts are called Decision Variables. Solver allows you to create constraints on the value of any Decision Variable.
Adding a Constraint to the Solver

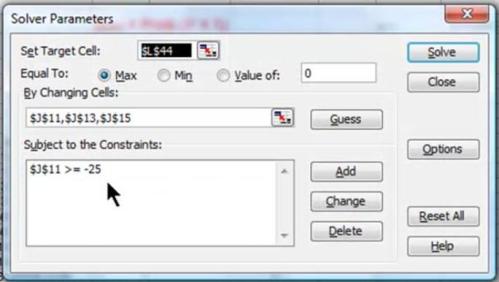
In the video, you will be able to watch how a Decision Variable is constrained to make the final answer more accurate. The Decision Variable called Constant was constrained to always remain above -25 during the Solver analysis. This resulted in the most accurate and realistic maximization of the sum of the P(X)Y * [ 1 - P(X) ] (1-Y) equations.
Conclusion – Logistic Regression in Excel Is an Incredible Predictor but Not the Simplest Analysis
Logistic Regression is not the simplest type of analysis to understand or perform. Hopefully this chapter and video have provided a much clearer picture for you.