How to Do Advanced Business Statistics
and
Create Interactive Statistical Graphs
ALL
IN EXCEL
Clear and Simple Yet Complete Instructions
to Perform MBA-Level Statistics
Entirely in Microsoft Excel
All Lessons in the Graphing Manual Are In
STREAMING VIDEO
for Easy and Super-Fast Learning!
![]()
If you understand the basics of Excel,
you can master MBA-Level Statistics
10 times faster than taking a statistics course,
AND
Learn It ALL In Excel.
Introducing the Statistical e-Manual Series You Need
The Excel Statistical Master
400+ Pages of MBA-Levels Statistics With LOTS of Worked-Out Problems,
Each
Problem Loaded with Screen Shots So You Can See Exactly
How
Each Is Solved in Excel.
Also
Learn Exactly How to Create Interactive
Graphs of All of the Popular Distributions.
![]()
The Excel Statistical Master - Manual 1 of 4
The Excel Statistical Master Is Absolutely the Fastest Way to Climb the Statistical Learning Curve
![]()
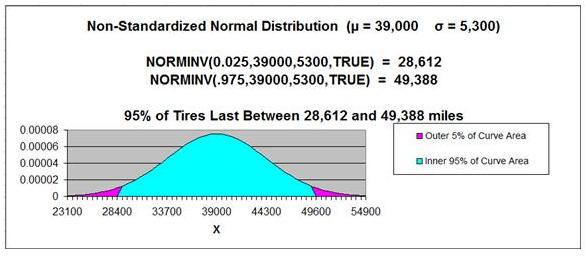
Screen shot of the output for one of the many Normal Distribution problems
in the 4 manuals.
You'll become an expert at using Excel formulas to solve Normal Distribution
problems.
You will be able to create graphs in Excel exactly like the one above
AND, with knowledge of Excel statistical functions,
You will NEVER have to look up anything up in a statistics table ever again.
You need this manual if any of these statements describe you:
- "I need to learn advanced business statistics but I simply don't have the time to take a statistics course or master a thick, confusing statistics textbook."
- "I already have taken a statistics course but I've forgotten a lot of the concepts I learned. I'd like to get that knowledge back but it is just too much trouble to start reading through those textbooks again.
- "The statistics books that I've seen don't present statistics in a useful, organized manner. Isn't there a manual that explains business statistics in a straight-forward, step-by-step way that I can understand?"
- "Every time I do a statistics problem, I have to relearn how to use the statistics tables and lots of statistical theory. I wish I could do this on Excel and not have to look at a statistics table or textbook ever again."
- "I've got a working knowledge of Excel and I know that Excel has statistical function. I wish I could master them and solve real-life business statistical problems."
- "The statistics books I've seen are loaded with too many irrelevant academic theories that aren't useful for solving the statistics problems that I want to solve. It's hard for me to tell what is important and what isn't. Why can't someone create a manual that teaches the concepts that I'll use and doesn't waste my time with unnecessary, complicated theories that are only academic exercises?"
- "I want to know how to use software to solve statistics but I don't want to spend $1,500 on SAS or SPSS and then have to try to learn them either. Show with me how to do statistics on an advanced level with Excel, which I own and am proficient at."
- "I really don't know that much about statistics at all. Statistics is beyond confusing to me. I wouldn't even know where to start. Can it really be possible for me to actually understand and apply MBA-level statistics to solve real-life problems?"
If any of those statements
sound like concerns that you've ever had
about learning statistics,
The Good News Is
This:
Finally a manual has been created that covers MBA-level statistics in
complete detail for Excel, but, unlike every other statistics book ever written,
this manual instructs entirely in a
step-by-step with a
major
emphasis on problem-solving. The statistical theories you need for
problem-solving are explained in simple language. Your time will not be wasted
with statistical minutia that is not useful in the real world.
Get the 400+ page Excel
Statistical Master pdf
Download in 5 Minutes!
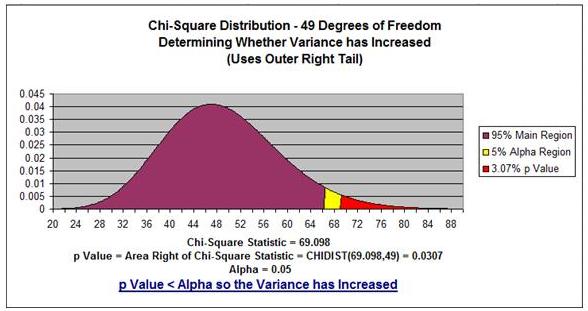
Screen shot of the output of a Chi Square Variance Analysis problem.
It may look complicated now but you will soon know EXACTLY
when and how to use Chi Square analysis
AND
how to create graphs in Excel exactly like the one above.
Every chapter is loaded with problems that walk you through each step with screen shots. No more confusion. No more trying to figure out which theory to apply.
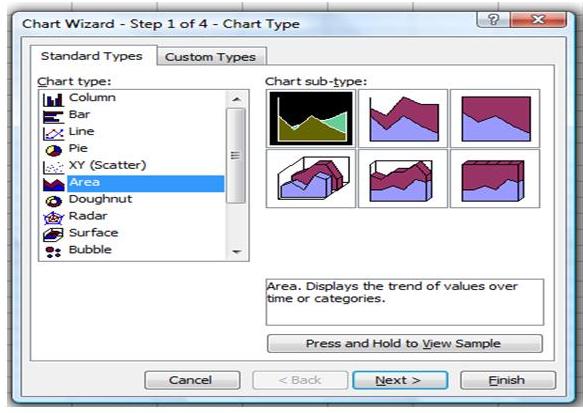
Screen shot of the 1st step for creating most statistical graphs in Excel.
Detailed screen shots of all steps are shown.
By the time you are through with this course module, you will be so
familiar
with creating graphs that you will be able to generate any of the graphs
you've seen on this web site with ease.
The practical theories and concepts that you need are explained, not by a Ph.D'ed statistician, but by a business manager for business managers and MBAs just like you. Even if you have never taken a statistics course or picked up a statistics book, you will not be confused by this manual. This manual was written from page one to be understandable by anyone with only a working knowledge of Excel. You can be a complete novice to statistics and you will be able to easily able to comprehend the MBA-level statistical problem-solving methods presented in this manual.
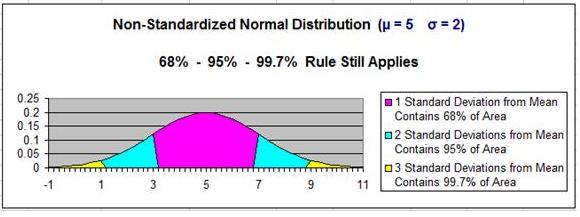
You've seen the above graph on the Normal Distribution section on this site.
You'll be able to create graphs in Excel just like this one,
EVEN BETTER...
You'll be able to make your graphs interactive so you can quickly vary
parameters such as
standard deviation and mean and watch how the graph immediately changes.
The information in this time-saving manual is presented only in bite-size chunks. No long-winded, incomprehensible paragraphs. Anyone who has ever to wade through nearly every statistics textbook out there knows how much fun and useful that is.
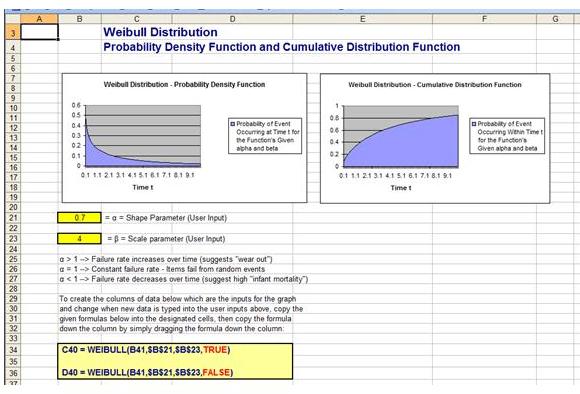
Screen shot showing how to create Weibull Distribution graphs.
If you follow the screen shots exactly, you will soon be able to create
stunning graphs of many of the most important statistical distributions.
Your graphs will also be interactive so that you can easily change any input parameter
and watch your changes be reflected immediately in a new graph.
I originally wrote this manual for my own use as an Internet marketing manager. My job requires a lot statistical analysis and I simply needed a quick reference for doing business statistics on Excel. The manual was so useful to me that I knew that other business managers and MBAs would really appreciate and use this book just as much as I did. I expanded this manual to cover nearly all of the topics that I had to master in my MBA statistics course.
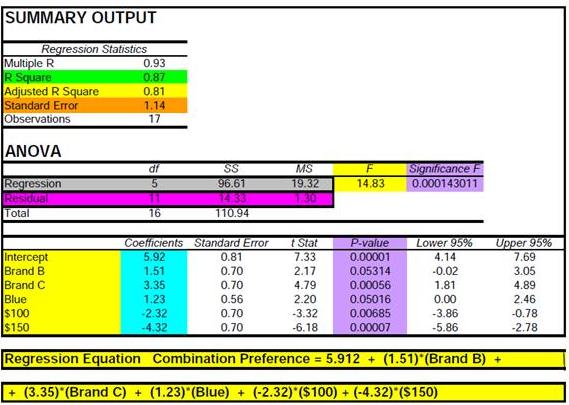
Screen shot of the Excel output of a Regression analysis problem.
This course explains Regression simply, clearly, and in a way you will FULLY
understand.
You will know when to use Regression, how to use it correctly, how to run a
Regression problem through Excel (it's so quick), how to generate an output just
like
the one above, and how to interpret each number in the output.
It took a lot of work to research and write this manual but it has become one of my most-used books at my office. This book was written for one purpose - to solve real-life statistical business problems in Excel without having to think too much. The theory behind the each problem is explained in the terms that any person familiar with Excel can understand. You certainly don't need to be a statistical master to grasp each and every one of these problems --> both the underlying statistical concepts and the practical application of Excel to solve it are fully, simply, and clearly explained. Screen shots are at every step in this 400+ page manual so you will be able to fly through every problem.
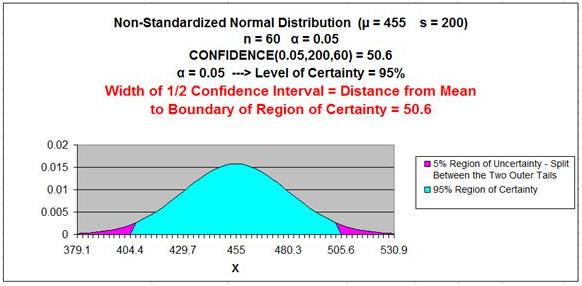
Screen shot of the output of one of the many Normal Distribution problems.
This is a two-tailed test that you will become thoroughly familiar during this
course.
You will understand exactly how and when to use two-tailed tests to solve
problems
AND
You will know how to create an output graph in Excel just like the one above.
There is no book out there that explains statistics as clearly, simply, and completely as this manual. Consider the Excel instructions to be an added bonus. I UNCONDITIONALLY GUARANTEE that you will find these manuals to be not just a little bit better but WAY better than any other statistics book you've ever looked at. Your money back immediately with no questions asked if you don't absolutely feel that way at any time after you purchase this series of e-Books.
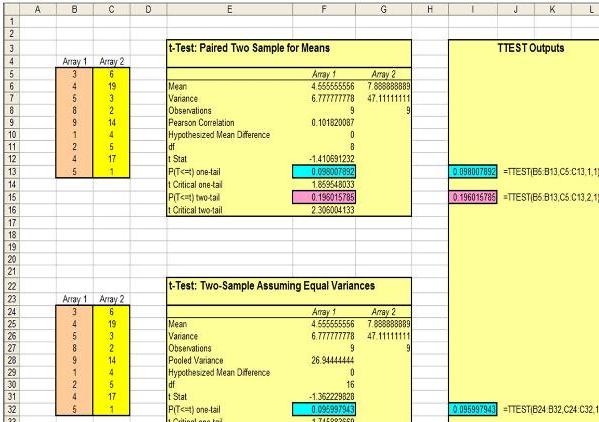
Screen shots comparing the outputs of different
Excel t-tests to the same data.
This screen shots shows that the t-Test functions (on the left) produce significantly
more
statistical analysis than the TTEST formulas (on the right). This is explained
in much more detail in the manual. You'll completely understand
when and how
to use each Excel t-test function, how to generate output results
like the above,
and how to correctly interpret those results.
One common complaint about statistics books and courses is that general frameworks are not explained. When this happens, each statistics problem seems to be completely unrelated to any other problem. Without the frameworks, the student has to start from scratch with each and every problem.
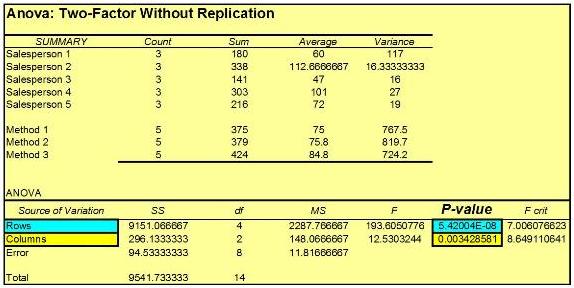
Screen shot of an ANOVA problem output.
You'll understand the difference between the many types of ANOVA tests
aand when to use each. You'll also be able to correctly apply the Excel ANOVA
functions to the different types of ANOVA tests,
and you will be able to generate and interpret ANOVA output just like the
above.
For the first time, a statistics manual has been created that uses a
step-by-step approach to each major topic. Finally a student of statistics
can proceed step-by-step through each problem that they are confronted with, no
matter how different the problem seems to be from all of the others. It is
possible to break down each and every major statistical topic into orderly steps
to follow that can be applied to every type of problem
in that category.
WIth This Manual You Will....
- Learn every major topic in most MBA statistics courses, from the basics to advanced topics such as conjoint analysis performed using dummy variable regression.
- Fully grasp how to solve every problem in every chapter with Excel. After you have finished this manual, you will have mastered Excel better than anyone else you know.
- Understand the step-by-step problem-solving frameworks which can be applied to every type of statistical problem you will run into. You won't find these frameworks anywhere else.
- Never rely on statistics tables and textbooks ever again. Mastering statistics on Excel will make statistics tables and thick textbooks as archaic as the slide rule (ever even seen one of those?).
- Thoroughly grasp advanced statistical topics such as ANOVA, Regression, every variation of Hypothesis Testing, and Chi Square Testing of Variance.
- Be able to build interactive graphs of the most popular distributions in Excel. As a special bonus, one quarter of the manual provides step-by-step instructions with screen shot of exactly how to construct all graphs in Excel. This information is available nowhere else.
The Excel Statistical Master belongs in the computer of every marketing manager, MBA student, statistics student, or anyone who needs to master statistics and would like to do it all in Excel.
It's a sad fact that most managers and MBAs who have taken a statistics
course would have real trouble solving the statistics problems that occur in the
ordinary course of a business manager's work life.
Imagine how your business life will change once
you acquire with this
powerful, easy-to-learn skill set.
- You will be confident of your ability to solve statistics problems that you run across on a regular basis.
- You will have the ability to perform intermediate-to-advanced statistical analysis anywhere that Excel is present. You'll never need to look up and figure out statistical tables and translate statistical theory hidden in a thick textbook.
- You will become the statistical master of your workplace.
- You will not have to hire a statistician to run statistical analysis for you. You will totally understand the analysis and be able to explain it because you have done it.
- You will know the major statistical mistakes that many statistics teachers and professors don't teach because they often don't know them. You'll be able to quickly spot statistical analysis that is invalid because of basic, fundamental mistakes. Unbelievably, this happens all the time, even by "experts." Once you learn what the major mistakes are, they stand out like a sore thumb whenever you run across them.
- You will have a powerful, new qualification that will help you advance in your current career or even help you locate more lucrative employment. Business managers who are strong in statistics are rare yet every business has issues and problems that you will now be able to solve.
The Excel Statistical Master will arm you with a slew of powerful statistical
tools and frameworks.
If you want to become an Excel Statistical Master,
these are the e-manuals for you!
Click Here To View
The Book's Table Of Contents.